
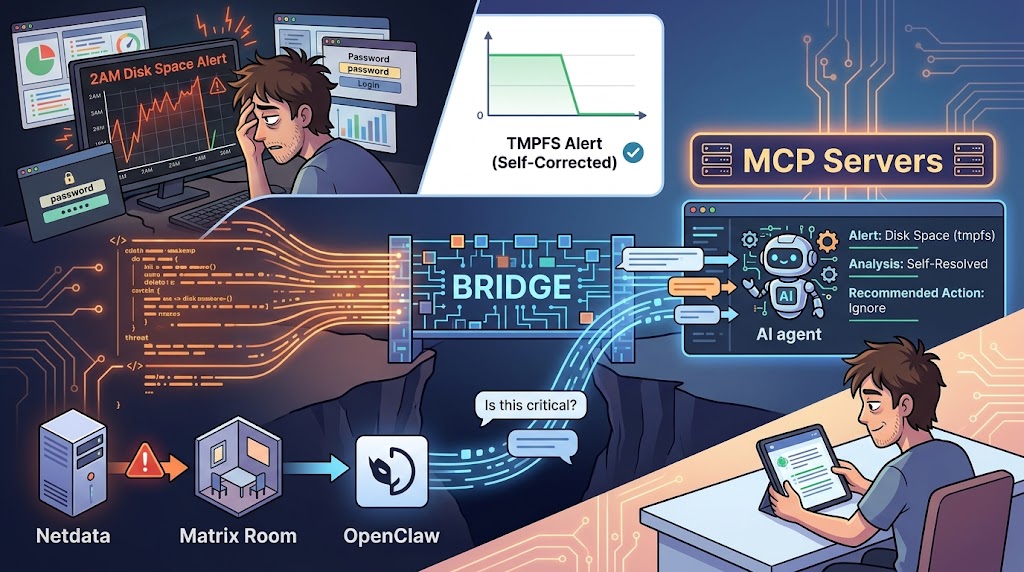
There is a special kind of despair reserved for 2am disk-space alerts. You get pinged, you squint at a chart, you open four dashboards you forgot the passwords to, and twenty minutes later you discover the “critical” alert was a tmpfs mount that fixed itself while you were still typing your username. This post is about making that problem someone else’s job — specifically, an AI agent’s job — without buying a whole “AIOps platform” or writing a pile of glue scripts nobody will maintain.
We already had Netdata watching the home lab and posting alerts into a Matrix room. We already had OpenClaw running as a personal assistant gateway. What we didn’t have was a bridge between “an alert fired” and “someone competent looked at it and told me what it actually means.” This is the story of building that bridge using Model Context Protocol (MCP) servers and plain old Matrix chat.
The Ask
The brief was refreshingly concrete:
Have an OpenClaw agent listen for Netdata alerts landing in a Matrix room, investigate using the same MCP-connected tools an existing assistant already had, and post back a structured report: Issue, Executive Summary, Diagnosis, Possible Fix, Other Useful Notes — later extended with a Sources section so a human could verify the agent’s homework.
Three things made this more than “just point an LLM at a webhook”:
- The alerts already existed. Netdata was already configured to post into a
#monitoringMatrix room via its own Matrix notification integration. Nothing to build there — just something to listen to. - The diagnostic tools already existed too. A different assistant (
infinigpt, a Python-based Matrix bot) already had working MCP integrations into seven different systems: Netdata itself, ManageLM (host/security inventory), Rancher (Kubernetes), PatchMon (patch management), ArgoCD (GitOps deployments), Nextcloud, and Open Notebook. We wanted OpenClaw to reuse those exact same connections rather than re-provision credentials or re-install tooling. - It had to be safe by default. Some of those seven systems can change things (delete an ArgoCD app, trigger a patch run, nuke a Nextcloud file). An LLM triggered by an external system’s alert text should not accidentally have write access to your Kubernetes cluster.
How This Was Done, In One Paragraph
OpenClaw was installed natively (not in Docker) on the same host as the rest of the Matrix stack, bound to loopback only and exposed exclusively over Tailscale Serve. Its Matrix channel plugin was scoped down to exactly two rooms via allowlists. Two of the seven MCP servers (Netdata, ManageLM) turned out to be genuine HTTP-based MCP servers under the hood, so OpenClaw was pointed at them directly — no bridge required. The other five only speak MCP over stdio and were only installed inside the existing infinigpt Docker container, so OpenClaw was configured to reach them via docker exec into that container, reusing its already-installed binaries and already-mounted credential files instead of duplicating any of it. A room-scoped system prompt then taught the agent how to tell a Netdata alert apart from a chat message from its human, and what shape to answer in. Then we broke it on purpose (well — tested it) by replaying real alert text through the room and reading what came back.
Now, the actual technical breakdown, because “in one paragraph” is a lie technical people tell to get to the good part faster.

Technical Breakdown: How Netdata Was Set Up
Netdata itself was pre-existing infrastructure — this project didn’t stand up Netdata, it plugged into it. But understanding its shape matters, because it explains why the whole thing works at all.
Netdata runs in a parent/child streaming topology: lightweight Netdata agents (“children”) on each host stream their metrics up to one “parent” server, which is where alerting and the MCP API actually live. That parent exposes Netdata’s MCP endpoint over plain HTTP:
# netdata.env (credentials redacted)
NETDATA_API_URL=http://100.72.101.17:19999
NETDATA_MCP_API_KEY=<redacted-bearer-token>
That 100.72.101.17 is a Tailscale address — the Netdata parent server lives on the same tailnet as everything else, which turned out to be extremely convenient later.
Separately (and this predates this project entirely), Netdata’s own alerting engine is configured to post notifications into the #monitoring:matrix.safehomelan.com room, authenticated as a dedicated @netdata:matrix.safehomelan.com Matrix account. That’s the actual “Netdata → Matrix” pipe. A real alert looks like this, verbatim, as it lands in the room:
⚠️ pve needs attention - high memory usage time ram./tmp
https://registry.my-netdata.io/registry-alert-redirect.html?agent_machine_guid=8b1af6a5-4ea8-4b2f-bc13-c67d91a195a3&host=pve&chart=system.ram&alarm=ram_in_use
Ugly. Effective. Absolutely not something you want to read on your phone at 2am without context — which is exactly the gap this project fills.
The other MCP-relevant piece already living on the Netdata side: infinigpt connects to that same MCP endpoint via a small Node.js shim called mcp-remote, because infinigpt‘s underlying LLM library only speaks stdio MCP, not raw HTTP MCP:
{
  "Netdata": {
    "command": "bash",
    "args": ["-lc", "set -a && . /config/netdata.env && set +a && \
      URL=\"$NETDATA_API_URL/mcp\"; mcp-remote \"$URL\" --allow-http \
      --header \"Authorization: Bearer $NETDATA_MCP_API_KEY\" --debug"]
  }
}
That detail matters, because OpenClaw doesn’t need this shim at all — which brings us to the OpenClaw side.
Technical Breakdown: How OpenClaw Was Set Up
The gateway itself
OpenClaw was installed as a source checkout (not Docker) directly on the box, running as a systemd user service, bound to loopback only:
git clone https://github.com/openclaw/openclaw.git ~/code/matrix-server/openclaw
cd ~/code/matrix-server/openclaw
pnpm install && pnpm build && pnpm ui:build
openclaw onboard --bind loopback --tailscale-mode serve --gateway-install
--bind loopback— the gateway process only listens on127.0.0.1. It is not reachable from the LAN, full stop, regardless of what the firewall does.--tailscale-mode serve— instead of opening a port to the world, OpenClaw manages its owntailscale serveprocess that reverse-proxies the loopback dashboard onto the tailnet with a real TLS cert (https://<machine>.<tailnet>.ts.net/). Only devices on the tailnet can reach it.
A single ufw rule rounds this out, since natively-run services (unlike Docker containers with their own network namespace) go through the host firewall:
sudo ufw allow in on tailscale0Scoping the Matrix channel down to two rooms
By default, a Matrix bot with groupPolicy: open will happily respond in any room it’s invited to. That’s not what we wanted — this bot should exist in exactly two rooms and nowhere else:
{
  "channels": {
    "matrix": {
      "homeserver": "http://127.0.0.1:8009",
      "groupPolicy": "allowlist",
      "autoJoin": "allowlist",
      "autoJoinAllowlist": [
        "!gxzkHydxPINWfuVjCr:matrix.safehomelan.com",
        "!hgHKZkQWlhiVppAGcs:matrix.safehomelan.com"
      ],
      "dm": { "policy": "disabled" },
      "groups": {
        "!hgHKZkQWlhiVppAGcs:matrix.safehomelan.com": {
          "enabled": true,
          "autoReply": true,
          "users": [
            "@davidfield:matrix.safehomelan.com",
            "@netdata:matrix.safehomelan.com"
          ]
        }
      }
    }
  }
}
Three settings are doing real security work here, not just tidying:
groupPolicy: "allowlist"+autoJoinAllowlist— the bot will only ever join the two rooms explicitly listed, by room ID rather than by mutable display name (room names can be renamed by anyone with the power level to do so; IDs can’t be spoofed the same way).dm.policy: "disabled"— direct messages are refused entirely. There is no “just DM the bot” attack surface.groups.<roomId>.users— a per-room sender allowlist. This one bit us early: Netdata’s own alert messages were being silently dropped because@netdatawasn’t on this list yet, and OpenClaw fails closed rather than open. The fix was one line — add@netdata— but it’s a good reminder that “the bot is in the room” and “the bot will listen to everyone in the room” are two different settings.autoReply: true— this one is a behavior choice, not a security one. By default, OpenClaw requires an explicit@mentionbefore it’ll respond in a group room (sane default for a general chat bot). For a dedicated alerting room, requiring a human to type@openclawin front of an automated alert message defeats the entire point, so this room opts out of that requirement.
Wiring up the MCP servers: two different shapes
This is the part that took actual investigation rather than just following a checklist. Probing each of infinigpt‘s seven MCP integrations revealed they weren’t all the same kind of thing under the hood.
Netdata and ManageLM are real HTTP MCP servers. They speak the streamable-HTTP MCP transport natively — you can point any MCP-aware HTTP client straight at them with the right headers. infinigpt only wraps them in stdio shims because its LLM library can’t speak HTTP MCP directly. OpenClaw has no such limitation, so it skips the wrapper entirely:
openclaw mcp add Netdata \
  --transport streamable-http \
  --url "http://100.72.101.17:19999/mcp" \
  --header "Authorization=Bearer $NETDATA_MCP_API_KEY"

openclaw mcp add ManageLM \
  --transport streamable-http \
  --url "https://managelm.safehomelan.com/mcp" \
  --header "x-mcp-id=$MANAGELM_MCP_ID" \
  --header "x-mcp-secret=$MANAGELM_MCP_SECRET"
(Credentials were read out of infinigpt‘s existing .env files into shell variables and never echoed to a terminal or a log — the same secrets, reused, not duplicated anywhere new.)
Rancher, PatchMon, Nextcloud, ArgoCD, and Open Notebook are stdio-only. Their “MCP servers” are actually local processes (rancher-mcp-server, patchmon-mcp, nextcloud-mcp-server, argocd-mcp, onb-mcp) that translate stdio JSON-RPC into calls against each system’s real REST API. Those binaries only exist inside the infinigpt Docker container, where they were npm install -g‘d or pip install‘d at build time. Rather than duplicating five separate installs and five separate credential copies on the host, OpenClaw just borrows the container:
openclaw mcp add Rancher \
  --command docker \
  --arg exec --arg -i --arg matrix-infinigpt --arg bash --arg -lc \
  --arg "set -a && . /config/rancher.env && set +a && rancher-mcp-server"
Same pattern for the other four — swap the container-internal .env file and the binary name. It’s a slightly unusual pattern (a stdio MCP “server” whose command is docker exec), but it’s a genuinely good one for exactly this situation: reuse already-working, already-tested tooling instead of forking it.
Both patterns were verified with the same command:
$ openclaw mcp probe
- ArgoCD: 16 tools, Codex approval auto
- ManageLM: 51 tools, Codex approval auto
- Netdata: 13 tools, resources, prompts, Codex approval auto
- Nextcloud: 129 tools, resources, prompts, Codex approval auto
- OpenNotebook: 54 tools, resources, prompts, Codex approval auto
- PatchMon: 12 tools, resources, prompts, Codex approval auto
- Rancher: 43 tools, Codex approval auto
318 tools, connected, real. And also — a genuinely uncomfortable number of ways to accidentally delete something, which brings us to the next section.
Making 318 tools safe to hand to a chatbot
An LLM that can query “is this VM’s memory usage normal” is useful. An LLM that can accidentally call “delete this Kubernetes application” because an alert message contained a confusing turn of phrase is a liability. So before any of this got wired into the alert-response flow, each server’s actual tool list was inspected and the genuinely mutating tools were excluded:
openclaw mcp tools ArgoCD --exclude \
  "ArgoCD__create_application,ArgoCD__delete_application,ArgoCD__run_resource_action,ArgoCD__sync_application,ArgoCD__update_application"

openclaw mcp tools Nextcloud --exclude \
  "Nextcloud__*delete*,Nextcloud__*create*,Nextcloud__*update*,Nextcloud__*trash*,\
Nextcloud__*restore*,Nextcloud__*archive*,Nextcloud__*assign*,Nextcloud__*remove*,\
Nextcloud__*move*,Nextcloud__*set_*"- Rancher and Netdata got zero exclusions — every tool either server exposes turned out to be
get_*/list_*/query_*/find_*style, plus Rancher already enforces read-only mode at the credential level (RANCHER_MCP_READ_ONLY=true). Nothing to trim. - ArgoCD lost five tools —
create_application,delete_application,run_resource_action,sync_application,update_application. Everything read-oriented (get_application*,list_applications,list_clusters,get_resource_events) stayed. - PatchMon lost two —
approve_patch_runandtrigger_patch, the two tools that actually push patches to real hosts.trigger_dry_run(a simulation) stayed, because it’s informative and harmless. - ManageLM lost two —
revert_task(undoes a prior action) andsend_email(a side effect nobody asked for). Its remaining 49 tools are almost entirelyget_*/search_*/list_*/run_*_scan— inventory and diagnostics, not control. - Nextcloud and Open Notebook got glob-pattern exclusions for every mutating verb (
create,delete,update,trash,restore,archive,assign,remove,move,set_*) rather than an enumerated list, because between them they exposed 183 tools and enumerating every safe one individually wasn’t a productive use of anyone’s afternoon.
This is a filter applied at the OpenClaw config layer, on top of the underlying credentials — belt and suspenders. Even if the filter were somehow bypassed, PatchMon’s admin credentials and Rancher’s read-only flag are still doing their own independent job underneath.
Teaching the agent to write the report
None of the above means anything without instructions. OpenClaw supports a room-scoped system prompt — extra instructions that apply only inside one specific Matrix room, layered on top of the agent’s normal behavior everywhere else. #monitoring got one; the general-purpose #managelm room did not, so this doesn’t change how the bot behaves anywhere except the one room it’s meant for:
When a message in this room is sent by @netdata:matrix.safehomelan.com, or
otherwise reads like an automated netdata alert (mentions a host/chart,
phrases like 'needs attention' or 'recovered', or a registry-alert-redirect
link), treat it as an infrastructure incident to investigate, not casual
conversation.

Before replying to an alert, actively investigate using the available MCP
tools: start with Netdata ... for the affected node/chart, then cross-check
whichever of Rancher, ArgoCD, PatchMon, and ManageLM are relevant to the
affected host or service.

Reply to alerts using exactly this structure, in this order, as markdown
headings:

**Issue** / **Executive Summary** / **Diagnosis** / **Possible Fix** /
**Other Useful Notes** / **Sources**

For plain conversational messages from @davidfield in this room that are
not alert-related, respond normally and do not force this report structure.
(Trimmed for the blog; the real prompt spells out exactly which Netdata tools to reach for first and gives each dashboard’s base URL for the Sources section.) That last paragraph is doing quiet, important work: this room isn’t alert-only. A human can still say “hey, what’s the current CPU load on pve?” and get a normal, unstructured answer — the five-section report format is reserved for things that actually look like alerts.
An Alert, and the Report It Got

Enough config. Here’s the thing actually working, verbatim, from a real test run against a real (if transient) memory-usage alert:
The alert, as Netdata sent it:
⚠️ pve needs attention - high memory usage time ram./tmp
https://registry.my-netdata.io/registry-alert-redirect.html?agent_machine_guid=8b1af6a5-4ea8-4b2f-bc13-c67d91a195a3&host=pve&chart=system.ram&alarm=ram_in_use
The report OpenClaw posted back, roughly 45 seconds later:
**Issue**
pve high memory usage warning — RAM in use at ~79% (99 GiB of 125 GiB).

**Executive Summary**
pve is a Proxmox VE host running several KVM virtual machines that form
your Kubernetes cluster (k8smaster1, k8snode1/2, rancher). The VMs are
pre-allocating their memory, which drives up the "used" figure as expected.
25 GiB is still available and swap is untouched — no actual memory pressure.

**Diagnosis**
- Memory: 99 GiB used, 15 GiB free, 11 GiB in cache/buffers, 25 GiB
  available. Swap: 8 GiB total, 0 B used.
- Top consumers: KVM VMs — k8snode1 (16 GiB allocated, 12.6% RSS),
  k8smaster1 (16 GiB, 12.4%), rancher (8 GiB, 6.3%).
- CPU: low across the board — ~4% system, ~0.4% user, ~0.5% iowait.
- Also active: a WARNING for inbound_packets_dropped_ratio on vmbr0
  (~2.7% drops) — unrelated and present since 09:24.

**Possible Fix**
Nothing actionable. This is expected behaviour for a Proxmox host with
VMs — KVM allocates the full guest RAM upfront. If you want to reduce
the reported figure, enable KSM or virtio-balloon ballooning. No
performance concern here.

**Other Useful Notes**
The vmbr0 packet drop warning is a separate, pre-existing issue worth
keeping an eye on if it escalates.

**Sources**
- Netdata: https://registry.my-netdata.io/registry-alert-redirect.html?agent_machine_guid=8b1af6a5-4ea8-4b2f-bc13-c67d91a195a3&host=pve&chart=system.ram&alarm=ram_in_use
- ManageLM: https://managelm.safehomelan.com
A few things worth pointing out about that response, because they’re the whole point of the exercise:
- It didn’t just repeat the alert. “High memory usage” became “here’s exactly which VMs are using it, and why that’s normal for a hypervisor host.”
- It queried real, live tools — actual current RAM/swap figures and per-VM breakdown came from Netdata and ManageLM MCP calls made during that 45 seconds, not from anything hardcoded in the prompt.
- It correctly recommended doing nothing. A worse system optimizes for looking busy. This one looked at swap usage being zero and said “there is no fire here,” which is the actually correct and much harder answer to reach.
- It noticed something else — the unrelated
vmbr0packet-drop warning — without being asked, because it was right there in the same alert-list query. - The Sources section only lists what it actually used. It didn’t cite Rancher or ArgoCD, because it didn’t need them for this particular question — a small detail, but it’s the difference between “citations” and “decoration.”
Why Do This In ChatOps At All?
It would be entirely possible to build a dashboard for this. A web page, a database, a “resolved/unresolved” workflow. Here’s why a Matrix room won, for a home-lab scale operation:
- Zero new surface area to check. The alert already arrives in a chat client you already have open on your phone. Adding a report to that same thread means there is no second app to remember to look at, and no dashboard tab that quietly accumulates thirty unread red badges you’ve trained yourself to ignore.
- The chat log is the incident log, for free. Every alert, every investigation, and every “yeah that was nothing” is already timestamped and threaded in order, with zero extra tooling. You didn’t build an incident-tracking system; Matrix’s timeline already was one.
- It’s a two-way door. Chat is naturally conversational — you can reply “is this related to the deploy from yesterday?” in plain English and get an answer, in the same room, using the same tools. A static dashboard can’t be asked a follow-up question.
- The trust boundary is the room membership, and that’s a boundary you already understand. Access control here isn’t a new auth system — it’s “who is in this Matrix room,” which is a concept every one of your other tools (and every human on your homelab) already respects.
- It scales down instead of up. No new service to run, no new database schema, no new port to expose. The entire “platform” is a chat room, a bot, and some MCP connections that were already sitting there half-used.
- It filters noise by design, not by dashboard-widget-configuration. Netdata alerts are terse and frequent by nature (that’s a feature — it means it’s sensitive). ChatOps lets something else absorb that frequency and hand you the two sentences that actually matter, instead of asking you to build alert-fatigue-reduction rules in a UI.
None of this is a novel insight — “ChatOps” has been a buzzword for a decade. What’s changed is that the “ops” part used to require someone writing bespoke Slack-bot glue code for every single integration. MCP turns “connect a new tool” into a config entry instead of a bespoke integration, which is the part that actually made this achievable in an evening rather than a quarter.
Final Thoughts
A few honest notes, because a blog post that only says “it worked” isn’t a technical one:
- This is a triage assistant, not an oracle. It reasons from whatever the MCP tools hand it, same as a human on-call engineer would from a dashboard. It can be wrong. The value isn’t “never check anything yourself again” — it’s “the first 80% of the investigation is already done by the time you open the room.”
- Tool safety is a judgment call, and it should be revisited. The exclude-list approach here was built by actually reading probed tool names, not by guessing — but as these MCP servers get upgraded, new tools can appear that weren’t there when the filter was written. This is a “check it again occasionally” system, not a “set and forget” one.
- Latency is a real, felt tradeoff. A report that cross-checks two or three systems takes 30–90 seconds to write, because it’s actually doing the work rather than templating a canned response. For a 2am disk-space scare, that’s a completely acceptable price for not having to open a laptop.
- The “no recent alert” case is still an open question. It’s tempting to also stand up a periodic heartbeat — a second, separate agent that checks every few hours that the Netdata → Matrix pipe itself hasn’t quietly died, and says so. That’s a genuinely different problem (verifying the absence of alerts isn’t broken, rather than reacting to their presence) and a good candidate for a follow-up post once it’s built rather than just planned.
- Reuse beat rebuild, every single time. The most consequential decision in this whole project wasn’t a prompt or a config flag — it was choosing to plug into
infinigpt‘s existing MCP connections and Netdata’s existing alerting pipe instead of standing up parallel infrastructure. The interesting work was three room-scoped settings and a system prompt; everything underneath it was already running before this project started.
The best infrastructure automation is usually the kind where most of the pieces were already sitting there, half-connected, waiting for someone to notice they could talk to each other.